What Is Data Analytics?
Data Analytics is the process of examining datasets to discover useful patterns, trends, relationships, and insights. Analysts use different tools and techniques to convert raw information into meaningful reports that support business decisions.
The major stages of analytics include:
- Data collection
- Data cleaning
- Data preparation
- Exploratory data analysis
- Data visualization
- Statistical analysis
- Report generation
- Business interpretation
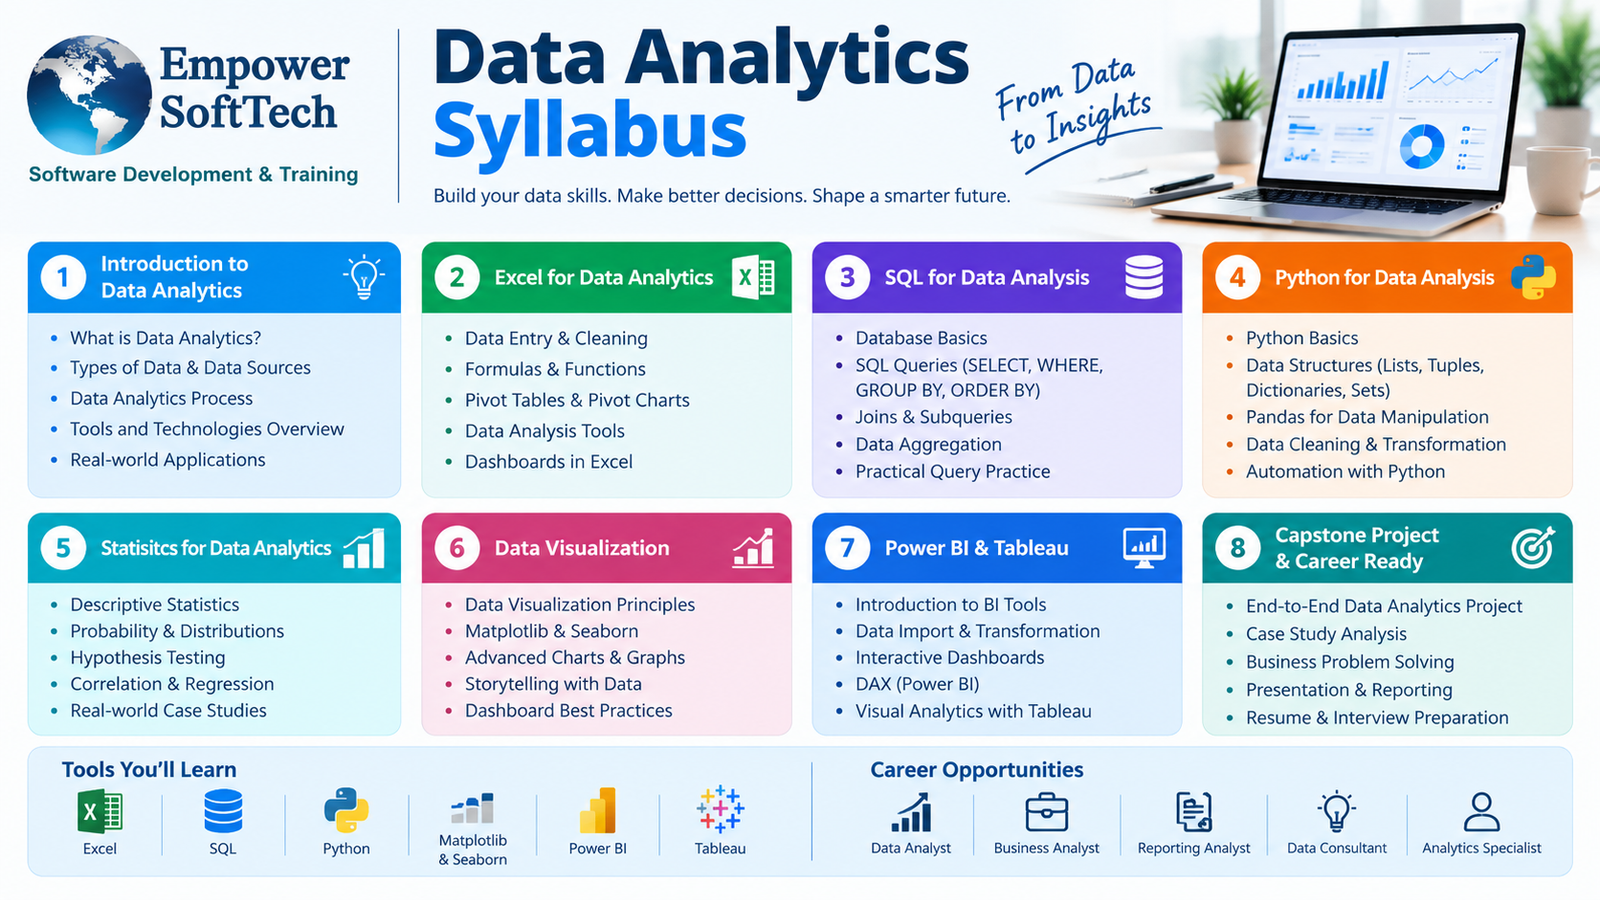
Complete Data Analytics Syllabus
Module 1: Introduction to Data Analytics
Students begin by understanding the fundamentals of Data Analytics.
Topics include:
- Introduction to Data Analytics
- Types of Data Analytics
- Descriptive Analytics
- Diagnostic Analytics
- Predictive Analytics
- Prescriptive Analytics
- Data Analytics lifecycle
- Role of a Data Analyst
- Applications of Data Analytics
- Data-driven decision-making
Module 2: Excel for Data Analytics
Microsoft Excel remains an important tool for analyzing structured data.
Topics include:
- Excel fundamentals
- Data formatting
- Sorting and filtering
- Excel formulas
- Logical functions
- Lookup functions
- Conditional formatting
- Pivot Tables
- Pivot Charts
- Data validation
- Data cleaning in Excel
- Dashboard creation
- Basic statistical analysis
Module 3: Statistics for Data Analytics
Statistics provides the foundation for understanding data and identifying meaningful patterns.
Topics include:
- Population and sample
- Mean, median, and mode
- Range
- Variance
- Standard deviation
- Percentiles
- Probability fundamentals
- Correlation
- Regression basics
- Hypothesis testing
- Statistical distributions
Module 4: SQL for Data Analytics
SQL is widely used for accessing and analyzing data stored in relational databases.
Topics include:
- Introduction to databases
- SQL fundamentals
- SELECT statements
- WHERE conditions
- ORDER BY
- GROUP BY
- Aggregate functions
- JOIN operations
- Subqueries
- Common Table Expressions
- Window functions
- Data manipulation
- Practical SQL queries
Module 5: Python for Data Analytics
Python is commonly used for data cleaning, analysis, automation, and visualization.
Topics include:
- Python fundamentals
- Variables and data types
- Conditional statements
- Loops
- Functions
- Lists and dictionaries
- File handling
- NumPy
- Pandas
- DataFrames
- Data cleaning
- Data transformation
- Exploratory Data Analysis
Module 6: Data Cleaning and Preparation
Clean and reliable data is essential for accurate analysis.
Students learn:
- Identifying missing values
- Handling duplicate records
- Detecting inconsistent data
- Handling outliers
- Data formatting
- Data transformation
- Data type conversion
- Combining datasets
- Preparing datasets for analysis
Module 7: Data Visualization
Data visualization makes complex information easier to understand.
Topics may include:
- Visualization principles
- Charts and graphs
- Bar charts
- Line charts
- Pie charts
- Scatter plots
- Histograms
- Interactive dashboards
- Choosing appropriate visualizations
- Data storytelling
Module 8: Power BI
Power BI is an important business intelligence and visualization platform.
Topics include:
- Power BI introduction
- Importing data
- Power Query
- Data transformation
- Data modeling
- Relationships
- DAX fundamentals
- Measures and calculated columns
- Interactive reports
- Dashboard creation
- Filters and slicers
- Publishing reports
Module 9: Tableau
Tableau may also be included in a comprehensive Data Analytics curriculum.
Topics include:
- Tableau fundamentals
- Connecting datasets
- Creating visualizations
- Worksheets
- Dashboards
- Filters
- Calculated fields
- Interactive reports
- Data storytelling
Module 10: Exploratory Data Analysis
Exploratory Data Analysis, or EDA, helps analysts understand datasets before applying advanced techniques.
Students learn to:
- Understand dataset structure
- Identify patterns
- Find trends
- Detect anomalies
- Analyze relationships
- Summarize datasets
- Create exploratory visualizations
- Generate analytical insights
Real-World Data Analytics Projects
Practical projects are an important part of a Data Analytics syllabus because they help students apply concepts to realistic datasets.
Example projects include:
- Sales data analysis
- Customer behavior analysis
- Marketing campaign analysis
- E-commerce analytics
- Financial data analysis
- Employee analytics
- Customer churn analysis
- Inventory analysis
- Business performance dashboard
Tools Covered in a Data Analytics Syllabus
Depending on the course, students may work with:
Excel | SQL | Python | Pandas | NumPy | Power BI | Tableau | Statistics | Data Visualization
Skills You Can Develop
After completing a comprehensive Data Analytics curriculum, learners can develop skills such as:
- Data cleaning
- Data analysis
- SQL querying
- Python programming
- Statistical analysis
- Dashboard development
- Data visualization
- Business reporting
- Analytical problem-solving
- Data-driven decision-making
Who Can Learn Data Analytics?
Data Analytics courses can be suitable for:
- College students
- Graduates
- Working professionals
- Business professionals
- IT professionals
- Beginners interested in analytics
- Professionals looking to develop data skills
Prior programming experience is not always required for beginner-level courses, although basic computer skills and an interest in analytical problem-solving can be helpful.
Career Opportunities After Data Analytics Training
A Data Analytics skill set can support career paths such as:
- Data Analyst
- Business Analyst
- Reporting Analyst
- BI Analyst
- Marketing Analyst
- Operations Analyst
- Financial Analyst
- Junior Data Scientist
Career requirements vary by role and employer, so learners should build practical skills and project experience alongside their coursework.
Why a Structured Data Analytics Syllabus Matters
A structured syllabus creates a clear learning path from fundamentals to practical analytics. Instead of learning individual tools separately, students can understand how spreadsheets, databases, programming, statistics, and visualization work together in a complete analytics workflow.
Conclusion
A comprehensive Data Analytics syllabus should combine fundamental concepts with practical tools and projects. Learning Excel, SQL, Python, statistics, Power BI, Tableau, data visualization, and exploratory analysis can provide a strong foundation for working with real-world datasets.
For learners in Hyderabad and other locations, choosing a course with practical projects, updated tools, hands-on assignments, and a clearly structured curriculum can help make the learning experience more effective.