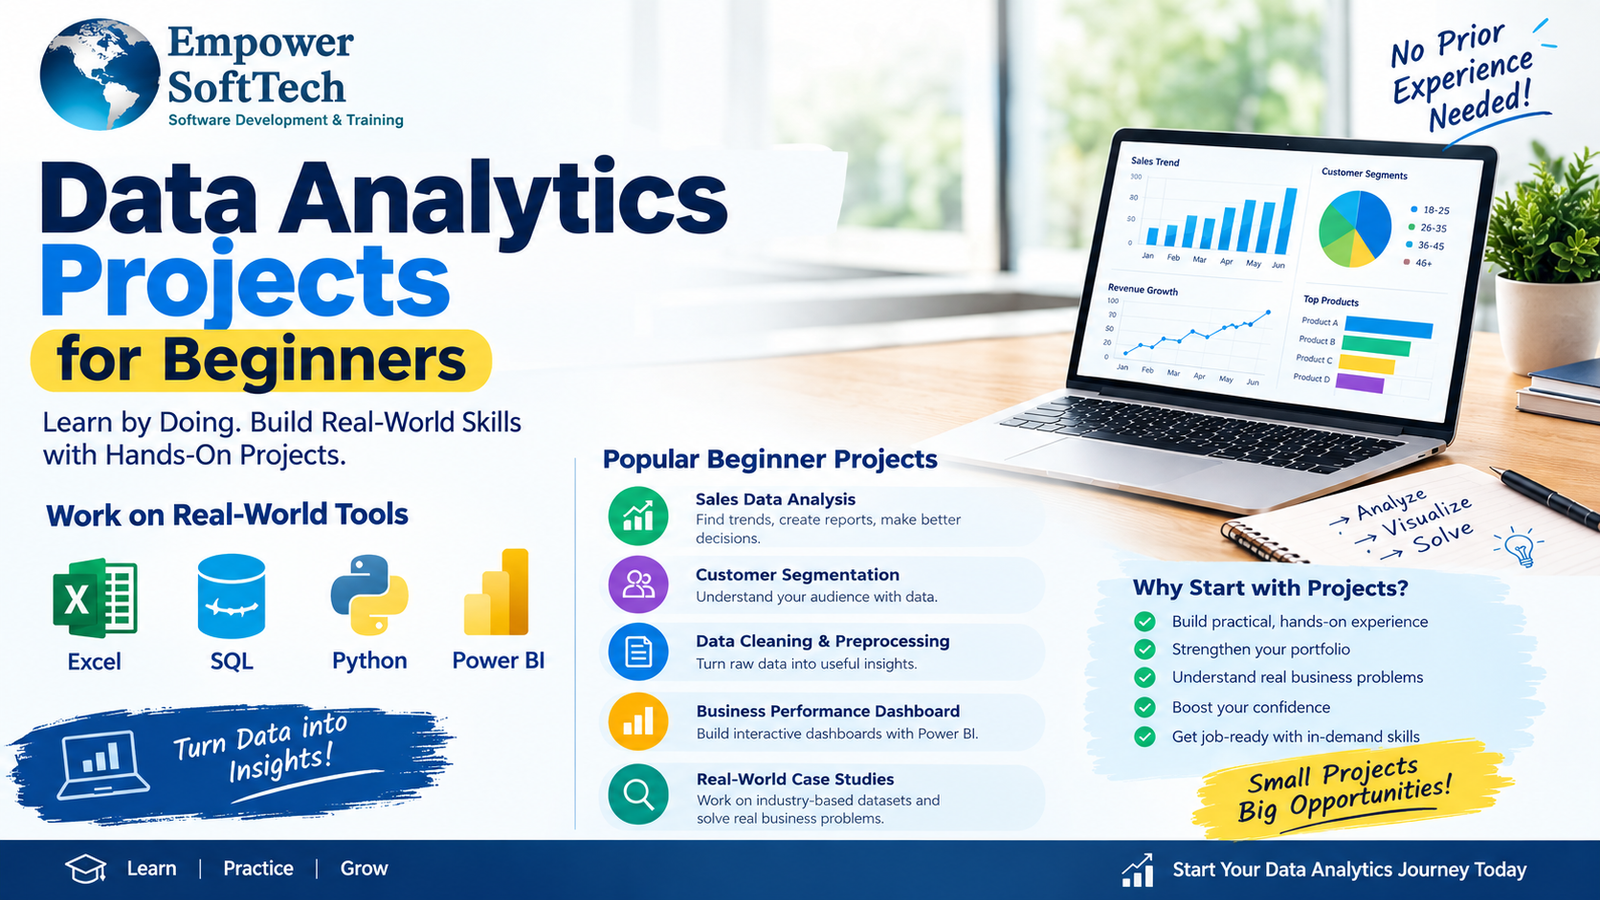
Data Analytics Projects for Beginners: A Complete Guide to Building Real-World Skills
If you are starting your journey in data analytics, working on Data Analytics projects for beginners is one of the most effective ways to turn theoretical knowledge into practical skills. Projects help you understand how data is collected, cleaned, analyzed, visualized, and transformed into useful business insights.
Whether you are a student, recent graduate, career changer, or someone learning analytics from scratch, beginner-friendly projects can help you practice tools such as Excel, SQL, Python, and Power BI while gradually building a professional portfolio.
What Are Data Analytics Projects?
Data analytics projects involve using datasets to answer questions, identify patterns, discover trends, and support decision-making.
A typical project follows a process such as:
Collect Data → Clean Data → Analyze Data → Visualize Data → Find Insights → Present Recommendations
For beginners, projects can start with simple spreadsheets and gradually progress toward SQL databases, Python analysis, and interactive Power BI dashboards.
Why Should Beginners Work on Data Analytics Projects?
Learning concepts is important, but practical experience helps you understand how analytics works in real situations.
1. Build Practical Skills
Projects allow you to apply concepts instead of simply reading about them.
You can practice:
- Data cleaning
- Data transformation
- Exploratory data analysis
- SQL queries
- Data visualization
- Dashboard creation
- Statistical analysis
- Business reporting
2. Create a Data Analytics Portfolio
A portfolio demonstrates what you can actually do.
You could include projects involving:
- Sales analysis
- Customer analysis
- Financial data
- Marketing performance
- Employee analytics
- E-commerce
- Inventory
- Business dashboards
A well-organized portfolio can also give you useful material to discuss during interviews.
Best Data Analytics Projects for Beginners
1. Sales Data Analysis Project
A sales data analysis project is a great starting point.
You can analyze:
- Total sales
- Monthly revenue
- Top-selling products
- Sales by region
- Customer purchases
- Product performance
- Seasonal trends
Tools: Excel, SQL, Python, Power BI
For example, you could create a dashboard showing monthly sales and identify which products generate the most revenue.
2. Customer Segmentation Project
Customer segmentation involves grouping customers according to characteristics such as purchasing behavior, location, or spending patterns.
A beginner project could analyze:
- Customer age groups
- Purchase frequency
- Average order value
- Customer locations
- Product preferences
Tools: Excel, Python, SQL, Power BI
This project introduces beginners to the idea of turning customer data into actionable business insights.
3. Data Cleaning and Preprocessing Project
Real-world datasets are often messy.
You may encounter:
- Missing values
- Duplicate records
- Incorrect formats
- Inconsistent names
- Invalid entries
- Unnecessary columns
A beginner can take a raw dataset and prepare it for analysis.
Tools: Excel or Python
This is an especially useful project because data cleaning is an important part of many analytics workflows.
4. Power BI Business Dashboard
Dashboard development is another excellent beginner project.
You could create a dashboard containing:
- Revenue
- Sales
- Profit
- Orders
- Customers
- Monthly trends
- Regional performance
Tools: Power BI and Excel
Use charts, cards, filters, and interactive visuals to make the information easy to understand.
5. SQL Data Analysis Project
SQL is widely used for working with structured databases.
A beginner SQL project could involve a retail database containing:
- Customers
- Products
- Orders
- Employees
- Transactions
You can practice queries using:
SELECT, WHERE, GROUP BY, ORDER BY, JOIN, aggregate functions, and subqueries.
The objective is to answer business questions using database information.
6. E-Commerce Analytics Project
E-commerce datasets provide many opportunities for analysis.
You could investigate:
- Best-selling products
- Customer purchasing patterns
- Revenue trends
- Average order value
- Product categories
- Repeat customers
Tools: Python, SQL, Excel, Power BI
This project can demonstrate how analytics can be applied to an online business.
7. Marketing Campaign Analysis
Marketing data can be used to understand campaign performance.
Analyze metrics such as:
- Click-through rate
- Conversion rate
- Campaign revenue
- Customer acquisition
- Channel performance
- Engagement
A dashboard can help compare different marketing channels and campaigns.
8. Employee Data Analytics Project
HR analytics is another beginner-friendly area.
You can analyze:
- Employee departments
- Job roles
- Salary information
- Experience
- Employee turnover
- Attendance
- Hiring trends
The project can demonstrate how data helps organizations understand workforce patterns.
Tools Beginners Should Learn
Excel
Excel is useful for:
- Sorting and filtering
- Formulas
- Pivot tables
- Charts
- Data cleaning
- Basic analysis
SQL
SQL helps analysts retrieve and analyze information stored in databases.
Important beginner topics include:
- SELECT statements
- Filtering
- Aggregation
- GROUP BY
- JOINs
- Subqueries
Python
Python can be used for more advanced data analysis and automation.
Popular libraries include:
- Pandas
- NumPy
- Matplotlib
Power BI
Power BI is useful for creating interactive dashboards and presenting analytical insights visually.
How to Start Your First Data Analytics Project
Follow this simple roadmap:
Step 1: Choose a Dataset
Start with a small and understandable dataset.
Step 2: Define the Problem
Ask what you want to discover from the data.
Step 3: Clean the Dataset
Check missing values, duplicates, inconsistent formats, and errors.
Step 4: Explore the Data
Look for patterns, trends, relationships, and unusual values.
Step 5: Analyze the Data
Use Excel, SQL, Python, or another suitable tool.
Step 6: Create Visualizations
Turn important findings into charts, graphs, or dashboards.
Step 7: Write Your Insights
Explain what the results mean in simple business language.
Step 8: Present the Project
Add the project to your portfolio with a clear description of the problem, process, tools, findings, and conclusions.
Tips for Beginners
When starting Data Analytics projects for beginners, avoid choosing extremely complicated datasets.
Instead:
- Start small.
- Learn one tool at a time.
- Practice data cleaning.
- Ask meaningful questions.
- Focus on explaining your findings.
- Build projects around realistic business problems.
- Document your process.
- Improve your projects as your skills grow.
Conclusion
Data Analytics projects for beginners provide a practical way to develop analytical thinking and technical skills. Starting with projects such as sales analysis, customer segmentation, data cleaning, SQL analysis, and Power BI dashboards can help beginners understand the complete analytics workflow.
The most important thing is to keep practicing. Start with a simple dataset, analyze it carefully, create meaningful visualizations, and explain the insights you discover. Over time, these projects can become a strong foundation for developing your data analytics portfolio and career skills.